The MarVis-Suite: Marker Visualization, Filtering, Clustering, and Functional Analysis
The
MarVis-Suite (
Marker
Visualization) is a toolbox for
interactive ranking, filtering, combination, clustering, visualization, and functional analysis of data sets containing intensity-based
profile vectors (data set features or marker candidates), as obtained e.g. from mass spectrometry (MS),
microarray, or RNA-seq experiments. The clustering algorithm is based on a realization of
one-dimensional self-organizing maps (1D-SOMs). Additionally, the MarVis-Suite includes
specialized functions for analysis of MS data in the context of non-targeted metabolomics studies,
such as adduct and isotope correction, molecular formula calculation, and pathway reconstruction based on accurate masses.
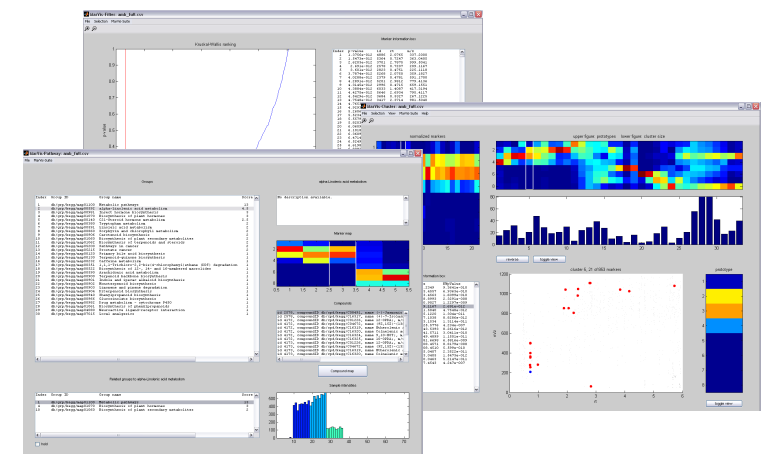
Within the MarVis-Suite framework, the MarVis-Filter interface provides functions for import, preprocessing,
filtering, and combination of raw data files, while the MarVis-Cluster interface was
designed for high-level visualization and cluster analysis. The MarVis-Pathway interface is used for functional annotation of
filtered/combined (cross-omics) data sets or selected clusters
in the context of reference or organism-specific pathway maps.
For statistical analysis of combined data sets from different omics platforms, MarVis-Pathway provides an extensive
framework for (Gene/Metabolite) Set Enrichment Analysis and meta-analysis. Within
the MarVis-Suite, selected data can be easily exchanged between the different interfaces.
Nonetheless, the interfaces can also be used as independent tools.
 The MarVis-Suite software is free for academic use. It comes with no guarantee or warranty at all.
Use it at your own risk. Please send questions, bug reports and feature requests to marvis(AT)gobics(DOT)de
The MarVis-Suite software is free for academic use. It comes with no guarantee or warranty at all.
Use it at your own risk. Please send questions, bug reports and feature requests to marvis(AT)gobics(DOT)de.
Download section
MarVis-Suite 2.0: MarVis-Filter, MarVis-Cluster, and MarVis-Pathway (2014) [1]
Currently, the
MarVis-Suite 2.0 is available for Windows XP/Vista/7/8. Click the following link to download the install package and follow the steps in the README-file.
Download MarVis-Suite install package for Windows XP/Vista/7/8 (397 MB)
The
MarVis-Pathway database bundle for pathway reconstruction can be found
here.
When running MarVis-Pathway for the first time, the directory into which these files have been extracted has to be specified.
Example data sets of a multi-omics case study in the context of plant wounding (one transcriptomics DNA microarray and four metabolomics MS data sets)
can be downloaded
here.
Additionally, a
protocol of the data analysis
and project files (see Load project function in the File menu of the corresponding MarVis-Suite interface) are available.
MarVis-Suite 1.0: MarVis-Filter and MarVis-Cluster (2011) [2]
The
MarVis-Suite 1.0 is available for Windows XP/Vista/7/8. Click the following link to download the install package and follow the steps in the README-file.
Download MarVis-Suite install package for Windows XP/Vista/7/8 (240 MB)
The
MarVis-Suite 1.0 documentation can be found
here.
Data sets (2011) [2,3]
Download LC/MS raw data matrices (including method description) of the case study for wounding in plants as CSV files (MarkerLynx Marker Report, unpolar extraction phase, negative and positive ionization mode).
The original MarVis(-Cluster) tool (2009) [4]
The original
MarVis tool is available for Windows XP/Vista/7/8 and Linux x86. Click the following links to download the install packages and follow the steps in the README-file.
MarVis was originally developed for the Windows operating system and then ported to Linux. Therefore we recommend the Windows version. When installing and testing
MarVis on Linux (Ubuntu 8.10, Fedora 10, openSuse 11.0) a number of additional packages had to be installed and minor bugs regarding the GUI-elements occurred. For experienced users we have added the corresponding references to the README-file.
Download MarVis install package for Windows XP/Vista/7/8 (230 MB)
Download MarVis install package for Linux x86 (290 MB)
The documentation for
MarVis can be found
here.
References
[1] Kaever A, Landesfeind M, Feussner K, Mosblech A, Heilmann I, Morgenstern B, Feussner I, Meinicke P.
MarVis-Pathway: integrative and exploratory pathway analysis of non-targeted metabolomics data.
Metabolomics 2014, DOI 10.1007/s11306-014-0734-y.
[2] Kaever A, Landesfeind M, Possienke M, Feussner K, Feussner I, Meinicke P.
MarVis-Filter: Ranking, Filtering, Adduct and Isotope Correction of Mass Spectrometry Data. Journal of Biomedicine and Biotechnology 2012, 2012.
[3] Meinicke P, Lingner T, Kaever A, Feussner K, Göbel C, Feussner I, Karlovsky P, Morgenstern B:
Metabolite-based clustering and visualization of mass spectrometry data using one-dimensional self-organizing maps. Algorithms for Molecular Biology 2008, 3:9.
[4] Kaever A, Lingner T, Feussner K, Göbel C, Feussner I, Meinicke P:
MarVis: a tool for clustering and visualization of metabolic biomarkers. BMC Bioinformatics 2009, 10:92.


